
Remote assessment of locally important ecological features across landscapes: how representative of reality?
August 12, 2015
A recently published paper in Ecological Applications describes the local ecological footprinting tool (LEFT), which uses globally available databases, modelling, and algorithms to remotely assess locally important ecological features across landscapes based on five criteria: biodiversity (beta-diversity), vulnerability (threatened species), fragmentation, connectivity, and resilience. This approach can be applied to terrestrial landscapes at a 300-m resolution within a given target area. Input is minimal (latitude and longitude) and output is a computer-generated report and series of maps that both individually and synthetically depict the relative value of each ecological criteria. A key question for any such tool, however, is how representative is the remotely obtained output compared to what is on the ground. Here, we present the results from comparing remotely- vs. field-generated outputs from the LEFT tool on two distinct study areas for beta-diversity and distribution of threatened species (vulnerability), the two fields computed by LEFT for which such an approach is feasible. The comparison method consists of a multivariate measure of similarity between two fields based on discrete wavelet transforms, and reveals consistent agreement across a wide range of spatial scales. These results suggest that remote assessment tools such as LEFT hold great potential for determining key ecological features across landscapes and for being utilized in pre-planning biodiversity assessment tools.
Reference: Willis KJ, Seddon AWR, Long PR et al. 2015. Remote assessment of locally important ecological features across landscapes: How representative of reality? Ecological Applications 25 (5):1290-1302. doi:http://dx.doi.org/10.1890/14-1431.1
Latest News
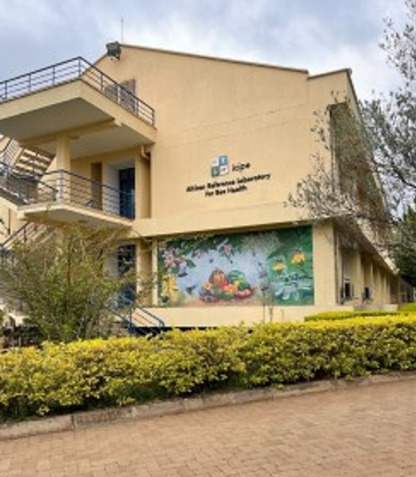
Vector Atlas Engagement and Partnership Meeting, December 2022
The Vector Atlas team is looking forward to welcoming representatives from over 15 African countries to the first Engagement and Partnership Meeting to be held at the International Centre ... Continue reading
Seeing roots from space
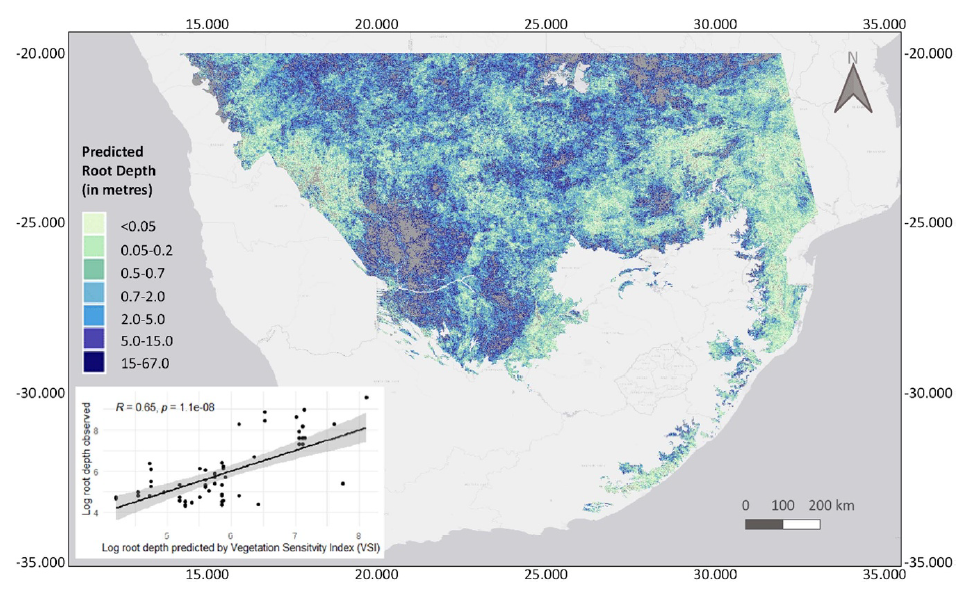
A new study led by Dr Nicola Kühn during her DPhil associated with the lab titled “Seeing roots from space: aboveground fingerprints of root depth in vegetation sensitivity to ... Continue reading
Vector Atlas Spatial Modelling Workshop, November-December 2022
We are excited to be holding the Vector Atlas Species Distribution Modelling Training Course at the International Centre of Insect Physiology and Ecology (icipe) in Nairobi, Kenya, 30 November ... Continue reading
Vector Atlas at the 8th Annual PAMCA conference
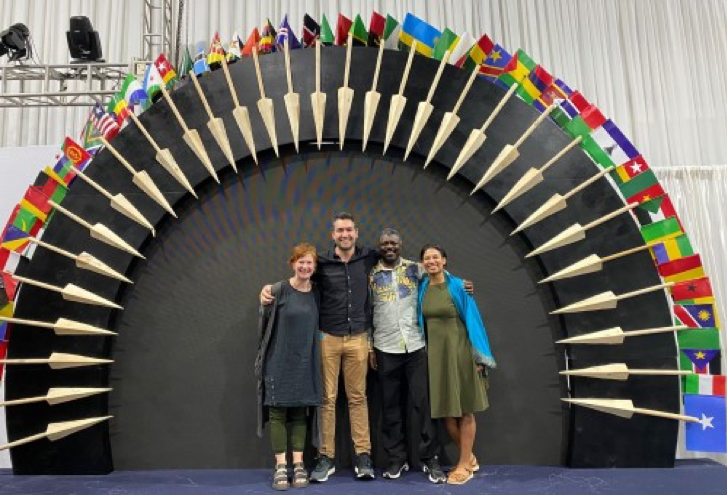
The Vector Atlas team had a great time at the 8th Annual Pan-African Mosquito Control Association (PAMCA) conference held in Kigali, Rwanda, from 26 to 28 September 2022. Excellent ... Continue reading
Vector Atlas Kick-off Meeting
The international Vector Atlas team gathered at the International Centre of Insect Physiology and Ecology (icipe) Duduville campus in Nairobi from 4 to 8 July 2022 to celebrate the launch ... Continue reading